
Monday was cold and cloudy. After an overnight frost the temperature only managed to reach a high of 2.9°C.
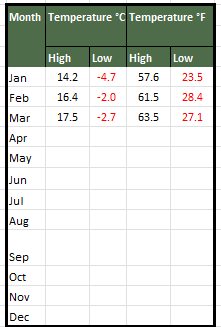
Back in January I posted that the Met Office reported that 2014 was the hottest year in the Central England Temperature records dating back to 1669. I thought it might be interesting to plot a comparison for this year to see how the year’s average temperatures build up. The left hand table below is the one published here in January and the table on the right this year’s average temperatures as they build up.

The monthly Central England Temperature data published by the Met Office can be found here. January has got us off to a much cooler start this year and as February had the highest anomaly* of any month last year the current cold spell needs to come to an abrupt end if we are to match last February’s average temperature.
*
I think I understand how the anomaly figure is worked out. Records from the CET between 1961 and 1990 are averaged out for each month and Jan 2014 is compared against the average value for the Januarys between 1961 and 1990 records. The difference between these two values is the anomaly. The result is that January 2014 was 1.9°C warmer than the long term average.


0 comments:
Post a Comment
Thank you for visiting my blog and leaving a comment - it is great to know that there are people out there actually reading what I write! Come back soon.
(By the way any comments just to promote a commercial site, or any comments not directly linked to the theme of my blog, will be deleted as soon as I spot them) Please do not follow links from any comments that appear to be spam - if in doubt ignore.